
The WTO revises its trade outlook
The World Trade Organization raised its forecast for merchandise trade volume on 8 October. It now expects growth of 3.9% in 2026 and 4.1% in 2027, compared with March projections of 1.9% and 2.6%. Reuters reports that demand for artificial intelligence equipment helped offset disruption in the Middle East. The organisation lowered its 2026 services forecast to 3.3%, while projecting 6.4% growth next year.
The uncertainty was already explicit in the WTO’s March assessment. Chief economist Robert Staiger described a scenario in which a persistent oil-price shock could reduce merchandise growth by half a percentage point, taking it to 1.4%. Stronger spending on AI-related products could instead add half a point. Those alternatives framed the risks surrounding the outlook available at that time. Revisiting them helps explain why an autumn revision can be substantial: the original assessment contained conditional paths for energy costs and investment demand, alongside its baseline forecast for the year.
Chip sales show the scale of demand
The Semiconductor Industry Association reported worldwide chip sales of $403.3 billion in the second quarter of 2026, an increase of 35.1% over the first quarter. Its August release therefore documented an expansion already recorded by the industry, before the October trade revision. Semiconductor sales are a broad measure covering multiple uses and markets. They establish the size of the business flowing through chip suppliers, although they do not identify how much of that value crossed a national border or how much ultimately went into artificial intelligence systems.
The association’s October update extended that picture. August semiconductor sales reached $159.7 billion, up 8% from the revised July figure of $147.9 billion and 144.3% from a year earlier. Sales through August exceeded $1 trillion for the first time. The monthly figures supplied by World Semiconductor Trade Statistics are three-month moving averages, which matters when interpreting their timing. The release also projected annual sales above $1.6 trillion. Its year-to-date milestone is an observed result; the full-year number remained an expectation when the update was issued.
Equipment investment predates the revision
Behind the chip market sits another industry producing manufacturing equipment. SEMI’s annual survey put 2025 equipment billings at $135.1 billion, compared with $117.1 billion in 2024, a rise of 15%. Testing equipment grew 55%, while assembly and packaging equipment increased 21%. China, Taiwan and South Korea together accounted for 79% of spending, up from 74%. This geographical concentration identifies major locations of investment in production capability. The equipment totals belong to a separate market from finished semiconductor sales, even though both describe parts of the same manufacturing chain.
SEMI’s first-quarter release recorded equipment billings of $36.55 billion in 2026, up 14% from the same quarter of 2025 and 1% from the preceding quarter. The association linked investment to advanced logic, dynamic random-access memory and advanced packaging. This result supplies an intermediate observation between the annual equipment figures and the later quarterly update. It measures supplier billings during a specific reporting period. The modest sequential increase and stronger annual comparison describe different baselines, so both are relevant to understanding the pace of expenditure at the start of the year.
The next quarterly equipment result was stronger on both comparisons. Billings reached $40.53 billion in the second quarter, increasing 23% year on year and 11% quarter on quarter. Published in September, the figures draw on monthly reports from members of SEMI and the Semiconductor Equipment Association of Japan. The reporting framework covers seven regions and more than 22 equipment segments. It offers a broad view of spending on production tools. SEMI associated the expansion with capacity and technology investment supporting AI infrastructure, an explanation offered by the industry organisation alongside its recorded figures.
A separate July forecast described how that investment might develop. SEMI expected equipment sales of $165.9 billion in 2026 and $229.5 billion in 2028. Within its 2026 projection, wafer-fabrication equipment accounted for $143.9 billion, testing for $15.3 billion and assembly and packaging for $6.7 billion. The association connected demand to AI and the complexity of high-bandwidth memory production. The breakdown shows that manufacturing investment involves several stages beyond processing wafers. These annual estimates were forward-looking when published, whereas the quarterly billing reports measure expenditure already reported by suppliers.
Computing and networking expand together
Nvidia’s first quarter of fiscal 2027, ending on 26 April, produced revenue of $81.6 billion, up 85% from a year earlier and 20% from the preceding quarter. Data-centre revenue reached $75.2 billion. Within that business, computing contributed $60.4 billion and networking $14.8 billion, with annual growth of 77% and 199%, respectively. This division is useful because AI infrastructure requires connections between computing resources as well as the processors themselves. The company’s reported revenue separates those activities, providing a more specific view than a single aggregate number for its data-centre business.
Nvidia’s following quarter, ending on 26 July, brought total revenue of $96.2 billion. The increase was 106% year on year and 18% sequentially. Data-centre revenue reached $89 billion, rising 117% annually and 18% from the first quarter. The August announcement reported a gross margin of 75%. These figures describe the company’s recognised business during its fiscal reporting periods. The margin is a measure of financial performance, while revenue measures sales value. Neither supplies a count of processors shipped, a country-by-country customs record or an estimate of the contribution to global trade volume.
AMD supplied another perspective in its second-quarter results. Total revenue reached $11.5 billion, increasing 50% from a year earlier. Its data-centre segment generated $6.7 billion, up 107%, representing 58% of company revenue. AMD attributed demand to its EPYC processors and Instinct accelerators. Its client and gaming business contributed $3.8 billion, while embedded products generated $977 million. The segment split shows the prominence of data-centre demand within this particular supplier’s sales mix. It also preserves the distinction between that business and the other applications served by the company’s semiconductor products.
Broadcom reported total revenue of $29.6 billion for its fiscal third quarter, ending on 2 August, an annual increase of 86%. AI semiconductor revenue amounted to $16.7 billion, up 221% year on year and 54% sequentially. The company cited demand for custom AI accelerators and networking. Its next-quarter outlook anticipated $21.7 billion in AI semiconductor revenue and $34.8 billion overall. The distinction between the reported quarter and the outlook is material: the announcement contained both sales already recognised and the company’s expectations for a subsequent period of business.
Memory investment adds a different part of the infrastructure story. Micron’s fiscal fourth quarter, ending on 3 September, generated revenue of $54.23 billion, compared with $41.46 billion in the preceding quarter. Net capital expenditure was $10.77 billion for the quarter and $27.37 billion across the fiscal year. The company also reported sampling 512-gigabyte server memory modules and qualifying another server module technology. Sampling and qualification describe stages in product development and customer readiness. They sit alongside the financial results but do not mean that every newly described product was already being supplied in volume.
TSMC’s second-quarter results connect the demand picture with semiconductor manufacturing. Dollar revenue reached $40.2 billion in the quarter ending on 30 June, up 33.7% annually and 12% sequentially. Technologies of seven nanometres and below accounted for 77% of wafer revenue: two nanometres contributed 3%, three nanometres 30%, five nanometres 33% and seven nanometres 11%. These are shares of revenue associated with process technologies. They are not percentages of individual chips produced. The distinction preserves what the manufacturing breakdown actually measures when considering the role of advanced production in the wider market.
Orders, revenue and delivery pipelines
Dell Technologies’ fiscal first quarter, ending on 1 May, recorded AI server orders of $24.4 billion and recognised AI server revenue of $16.1 billion. That revenue was 757% above the year-earlier level. Traditional servers and networking generated $8.5 billion, while storage contributed $4.3 billion. The reporting separates customer commitments from sales recognised during the quarter and distinguishes AI servers from other infrastructure products. These categories show several points in the equipment business: customers place orders, the supplier carries out the associated work, and qualifying sales subsequently appear in reported revenue.
Dell’s second-quarter announcement put AI server orders at $60.9 billion, recognised revenue at $16.4 billion and the backlog at $95 billion. The quarter ended on 31 July. Traditional servers and networking generated $10.5 billion, increasing 122% annually, while storage revenue of $4.9 billion rose 26%. Dell raised its fiscal-year AI server revenue forecast to $74 billion from $60 billion. The large backlog describes business awaiting fulfilment under the company’s reporting, giving a view beyond current-quarter recognised sales. Its forecast expresses the company’s expected outcome for the full fiscal year.
Hewlett Packard Enterprise reported revenue of $12.2 billion for its fiscal third quarter, ending on 31 July, up 34% annually. The Cloud and AI business generated $9 billion. Servers contributed $6.8 billion, storage $1.3 billion and data-centre networking $382 million. Server revenue rose 35.3% and data-centre networking 112.2%. The Cloud and AI segment also includes financial services, so its total has a broader scope than hardware alone. Reading the component figures alongside the segment label gives a clearer view of the different activities included in this infrastructure supplier’s results.
Cloud spending has several accounting measures
Microsoft reported capital expenditure of $41 billion in its fiscal fourth quarter of 2026. Roughly two thirds concerned relatively short-lived assets, including central processing units and graphics processing units. The figure included $5.6 billion of finance leases, while cash purchases of property and equipment amounted to $35.8 billion. Cloud revenue reached $59.3 billion, increasing 27%. The expenditure breakdown helps explain why investment announcements contain several totals: cash purchases and lease-financed assets enter different accounting measures. For infrastructure demand, the composition of spending is useful alongside the headline size of the quarterly investment.
Meta’s second-quarter capital expenditure was $31.08 billion, including principal payments on finance leases. Operating cash flow amounted to $31.86 billion and free cash flow to $784 million. The company’s full-year capital expenditure outlook was $130 billion to $145 billion, narrowing the earlier range of $125 billion to $145 billion. This disclosure concerns company-wide investment, rather than a separately measured total for AI equipment. Its cash-flow figures show how substantial expenditure related to the funds generated in the reporting period. The annual range remained an outlook when the July results were released.
Amazon’s second-quarter results reported Amazon Web Services revenue of $42.2 billion, up 37%, and operating income of $16.6 billion. The company described its AI and chip businesses as each exceeding a $25 billion annualised revenue run rate. Such a run rate scales a current pace of business; it differs from revenue already earned over an entire year. Over the trailing twelve months, operating cash flow reached $161.4 billion and free cash flow was negative $7.6 billion. Amazon linked increased equipment spending primarily to AI, connecting infrastructure investment with the financial demands of expansion.
Electricity supplies the physical foundation
The International Energy Agency’s 2025 Energy and AI report estimated that data centres consumed 415 terawatt-hours of electricity in 2024, around 1.5% of worldwide consumption. Servers accounted for approximately 60% of electricity use within a data centre, storage around 5% and networking up to 5%. Cooling ranged from about 7% in efficient hyperscale facilities to more than 30% in less efficient enterprise facilities. This composition explains why the infrastructure extends beyond chips and servers. The power requirement also depends on the equipment and systems needed to keep a facility operating at suitable temperatures.
The agency’s 2026 update reported that data-centre electricity consumption grew 17% in 2025, against growth of 3% worldwide. It identified pressure on supplies of chips, gas turbines and transformers, together with delays associated with grid approvals. Its projection envisaged data-centre electricity demand doubling by 2030 and AI-related demand tripling. These future estimates sit alongside a recorded annual growth comparison. The supply constraints concern different parts of an operating facility: computing equipment, electrical components and access to power. They explain why a spending commitment alone does not describe the full process of bringing additional capacity into service.
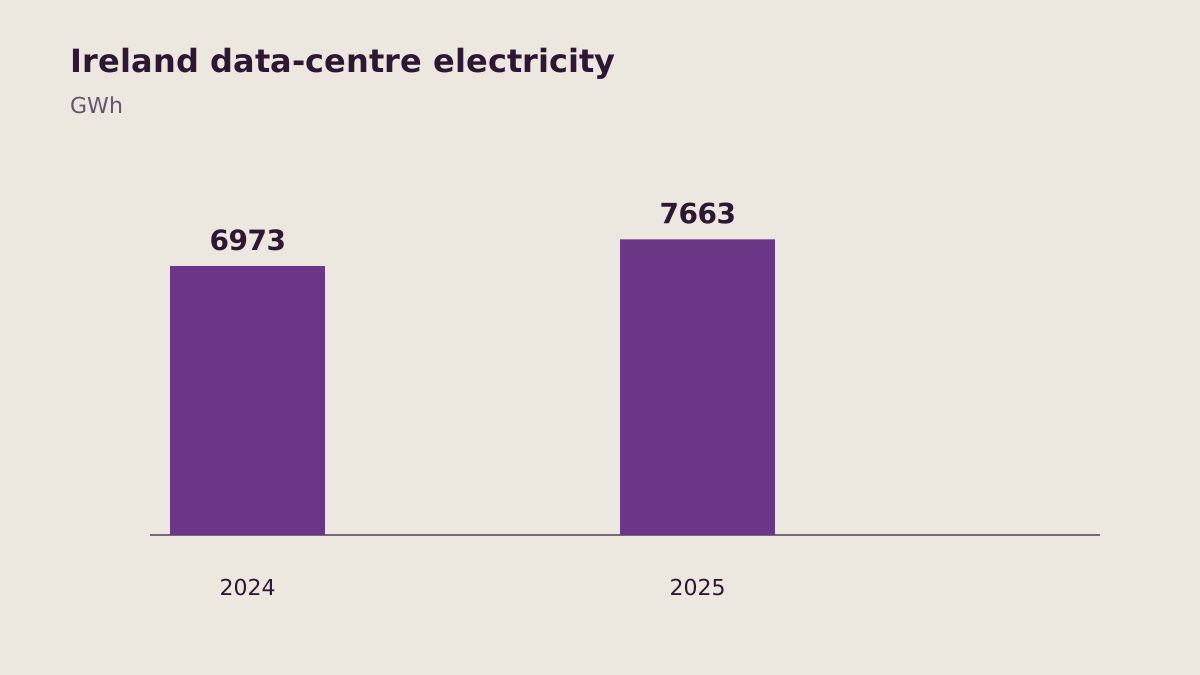
A national example comes from Ireland’s Central Statistics Office. Metered data-centre electricity consumption reached 7,663 gigawatt-hours in 2025, compared with 6,973 in 2024, an increase of 10%. Data centres accounted for 23% of metered electricity consumption, against 5% in 2015. Consumption by other users increased 2%. The figures cover identified data-centre facilities, rather than isolating power used only for AI.
Digital services and a broader trade landscape
The WTO’s digitally delivered services dataset covers more than 200 economies and regions, eight sectors and the years 2005 to 2025. Its definition concerns services supplied through computer networks, including the internet, applications, email, voice and video connections, and digital intermediation. This provides a statistical category for delivery methods that differ from moving physical equipment across borders. The methodology follows the joint handbook developed by the International Monetary Fund, OECD, UN Trade and Development and the WTO. Delivery channels include:
- Internet applications and email.
- Voice and video connections.
- Digital intermediation services.
UN Trade and Development’s March discussion of trade reform placed technological investment within a broader international market. Trade between developing economies rose from $500 billion in 1995 to $6.8 trillion in 2025, accounting for more than a quarter of world trade. The organisation discussed policy volatility and fragmentation as risks to exports, investment and diversification. That longer historical comparison shows the scale of commercial links beyond the largest technology companies. It gives the AI investment story a wider setting: international trade also reflects established relationships among developing economies and the policy environment in which their businesses operate.



Leave a comment